Late Pleistocene variations of the background aeolian dust concentration in the Carpathian Basin: an estimate using decomposition of grain-size distribution curves of loess deposits
Original paper: Varga et al. (2012).Late Pleistocene variations of the background aeolian dust concentration in the Carpathian Basin: an estimate using decomposition of grain-size distribution curves of loess deposits. Netherlands Journal of Geosciences – Geologie en Mijnbouw 91. (1–2) pp. 159–171.
Abstract
Aeolian dust deposits can be considered as one of the most important archives of past climatic changes. Alternating loess and paleosol strata display variations of the dust load in the Pleistocene atmosphere. By using the observations of recent dust storms, we are able to employ Late Pleistocene stratigraphic datasets (with accurate chronological framework) and detailed granulometric data for making conclusions on the atmospheric dust load in the past.
Age-depths models, created from the absolute age data and stratigraphic interpretation, allow us to calculate sedimentation rates and dust fluxes, while grain-size specifies the dry-deposition velocity, i.e. the atmospheric residence time of mineral particles. Thus, the dust concentration can be expressed as the quotient of the dust flux and gravitational settling velocity.
Recent observations helped to clarify the mechanisms behind aeolian sedimentation and the physical background of this process has nowadays been well-established. Based on these two, main contrasting sedimentary modes of dust transport and deposition can be recognized: the short suspension episodes of the coarse (silt and very fine sand) fraction and the long-range transport of a fine (clay and fine silt) component. Using parametric curve-fitting the basic statistical properties of these two sediment populations can be revealed for Pleistocene aeolian dust deposits, as it has been done for loess in Hungary. As we do not have adequate information on the magnitude and frequency of the Pleistocene dust storms, conclusions could only be made on the magnitude of continuous background dust load. The dust concentration can be set in the range between 1100 and 2750 μg/m3. These values are mostly higher than modern dust concentrations, even in arid regions. Another interesting proxy of past atmospheric conditions could be the visibility, being proportional to the dust concentration. According to the known empirical dust concentration–visibility equations, its value is around 6.5 to 26 kilometres.
Introduction
The global annual input of mineral dust aerosols, lifted into the atmosphere from deflating surfaces in arid-semiarid regions, is estimated to be between 1 to 3 billion t/y (Tegen et al., 1996; Zender et al., 2003). The magnitude and frequency of these dust storm events are sensitive to environmental changes and climate owing to changing precipitation levels, wind strength, regional moisture balance, and extent of dust sources and also due to anthropogenic factors.
Dust is an active component of the climate and other environmental systems and plays important role in climate forcing. The atmospheric mineral dust particles reflect, scatter, and absorb the incoming shortwave solar and also the outgoing long wave terrestrial radiation, thereby modifying the Earth’s radiation balance in a direct way (Harrison et al., 2001; Kohfeld & Tegen, 2007; Pósfai & Buseck 2010). However, its indirect effects are also significant. By acting as cloud condensation nuclei, these particles may alter cloud characteristics (e.g. more and smaller cloud droplets, brighter clouds) and also the hydrological cycle (Rosenfeld, 2001; Sassen, 2003). Due to their high Fe-content, dust particles transported to the oceans potentially play an important role in the biogeochemical cycles providing micronutrients and affecting the carbon cycle (Ridgewell, 2002; Jickells et al., 2005).
Dust particles deposited on land surfaces could accumulate in large quantities, especially during the dustier periods of the Pleistocene glacials. In certain ecological environments, the accumulated dust might form loess via diagenesis. Loess sediments cover ca. 10% of continental surfaces (Pécsi, 1990), and almost the half of Carpathian Basin, where aeolian processes played gradually a more and more dominant role in the sedimentation from the Late Pliocene onwards. These widespread and thick loess-paleosol sequences record the Pleistocene glacial-interglacial variations. By correlating these sequences with ice cores and marine sequences conclusions on the timing and local/regional manifestation of global changes of environmental conditions (e.g. paleotemperature, atmospheric conditions, dust concentration) can be drawn.
A previous study on Hungarian loess (Varga, 2011) revealed that the grain-size distribution (GSD) curves of loess deposits are bimodal, with a pronounced peak in the coarse silt fraction and a shoulder in the clay-, fine silt fraction. These characteristics have been found common to our formerly analysed aeolian dust deposits in Hungary such as Lower and Middle Pleistocene loess–paleosol and Pliocene–Lower Pleistocene red clays (Kovács, 2008; Kovács et al., 2008; Varga, 2011) and also to other globally investigated terrestrial wind-blown sediments (e.g. Sun et al. 2002, 2004). The bimodal pattern of GSDs represents the mixing of two sediment populations that can be separated from each other by using mathematical methods i.e. fitting appropriate functions). These two populations can be interpreted as the fine-grained continuous background dust-load of the atmosphere and the coarse-grained product of episodic dust storms, by analogy with grain-size data of recent dust observations (McTainsh et al. 1997).
In this study we made an attempt to estimate the average Pleistocene aeolian background dust concentration in the Carpathian Basin by using sedimentation rates and granulometric data from loess-paleosol sequences. These dust-concentration data might be essential for Earth climate system models in evaluating their performances in terms of dust flux reconstruction capabilities.
Materials and methods
Stratigraphy and its relation to the atmospheric dust load
Alternating loess and paleosol strata of aeolian dust deposits mirror the variations of atmospheric dust load in the Pleistocene (Fig. 1.). During the dusty cold-arid glacial periods loess formation prevailed, while in the warmer and moister interglacial/interstadial phases soils were formed on loess by weathering and pedogenic processes. Varga (2011) claims that there was no significant dust input during the formation of the Hungarian Middle and Upper Pleistocene paleosols, based on grain-size data.

Fig.1. Generalized loess-paleosol sequence of Hungary and its possible correlation with benthic δ18O record of deep sea sediments, and δD and insoluble dust in the EPICA DOME C ice core. (In absence of age data, the correlations of Phe 1-2 and Mtp 1-2 weakly developed sandy and hydromorphic soils with MIS13 and MIS15 carry significant uncertainties. Sources: Pécsi & Schweitzer, 1995; Gábris, 2007; Lisiecki & Raymo, 2005; EPICA community members 2004).
The Upper Pleistocene loess series of Hungary include a pedocomplex that dates to the last interglacial (MF2), early-last-glacial loess, an interstadial pedocomplex (MF1), late-last-glacial loess and the modern, Holocene soil. This stratigraphic feature fits well into the regional picture, shows similarity to the Croatian (Galović et al., 2009), Serbian (Markovic et al., 2006, 2009; Antoine et al., 2009; Stevens et al., 2011) and Austrian (Peticzka et al., 2010) sections. If any of these stratigraphic units is missing, then the series cannot be regarded as a complete sequence (Mahowald et al., 2006).
In the case of poorly dated sections, the low stratigraphic preservation potential of loess sediments, being susceptible to reworking and redeposition by hydrological processes or mass movements, is querying the use of the assumed linear aeolian sedimentation models. The origin of paleosols is another problem of loess stratigraphy; thence sometimes it is difficult to assign the initiation of paleosols in the stratigraphic column since the material from which the soils were formed are glacial loesses and the soil formation proceeded downwards in the section during interglacial periods, so the thickness of the glacial aeolian dust deposits is underestimated in most cases. This was also emphasized in a study focused on other loess-paleosol sequences in Southeastern Europe (e.g. Buggle et al., 2009). Probably, the Lower Pleistocene red paleosols reflect a largely different depositional system, and these paleosols have been formed as vertically-accreted soil direct from the wind-blown dust (Varga, 2011). For these reasons, sections with accurate chronological framework (mostly with two or more independent dating series) and almost complete stratigraphic column were used in our calculations (Table 1.).
Table 1. The list of the sites used in our calculations (source: Újvári et al., 2010).
Site name
|
Dating method
|
Stratigraphic/dating
framework
|
Age model
|
Hungary
|
|||
Albertirsa
|
IRSL
|
21
|
21
|
Basaharc
|
14C, TL, IRSL, AAR
|
5,23,32,34,36
|
5,32,34
|
Bodrogkeresztúr I
|
14C
|
30,31,32
|
30,31,32
|
Csorgókút I
|
14C
|
30,31,32
|
30,31,32
|
Csorgókút II
|
14C
|
30,31,32
|
30,31,32
|
Debrecen (Alföldi brickyard)
|
14C
|
30,32
|
30,32
|
Dunaszekcső
|
14C
|
24,27
|
24,27
|
Dunaújváros
|
14C
|
24,27
|
24,27
|
Katymár
|
14C
|
9, 14,30,32,34
|
30,32,34
|
Lakitelek I
|
14C
|
30,32,34
|
30,32,34
|
Látókép
|
14C
|
30,32
|
30,32
|
Madaras
|
14C
|
4,10,30,32,34
|
4,10,30,32,34
|
Mende
|
14C, TL, IRSL, AAR
|
5,8,23,26,29,35,37
|
5,8,26,29
|
Paks
|
TL, IRSL, AAR
|
5,23,25,35
|
5
|
Ságvár
|
14C
|
7,8,12,33
|
7,8,12
|
Süttő
|
AMS 14C, IRSL,
AAR
|
22,23
|
22
|
Szeged-Öthalom I
|
14C
|
13,30,32
|
13,30,32
|
Tápiósüly
|
14C, TL
|
8,35
|
8,35
|
Tokaj (Kereszt Hill II)
|
14C
|
30,32
|
30,32
|
Tokaj (Patkó-quarry)
|
14C
|
30,31,32
|
30,31,32
|
Üveghuta-2 borehole
|
MS
|
11,20
|
11,20
|
Croatia
|
|||
Erdut
|
IRSL
|
6
|
6
|
Zmajevac
|
IRSL
|
6
|
6
|
Serbia
|
|||
Batajnica
|
MS
|
3,18,19
|
3,18,19
|
Crvenka
|
MS
|
18
|
18
|
Irig
|
MS, IRSL
|
17,18
|
17,18
|
Mošorin
|
MS
|
18
|
18
|
Petrovaradin
|
MS, AAR
|
15
|
15
|
Ruma
|
MS, AAR
|
16
|
16
|
Stari Slankamen
|
MS, IRSL-OSL
|
18,28
|
28
|
Surduk
|
AMS 14C, IRSL-OSL
|
1
|
1
|
Susek
|
MS
|
18
|
18
|
Titel
|
MS, IRSL
|
1,2,18
|
2
|
Abbreviations: 14C=conventional
radiocarbon dating; AMS 14C=Accelerator Mass Spectrometry
radiocarbon dating; TL=thermoluminescence; OSL=optically stimulated
luminescence; IRSL=infrared optically stimulated luminescence; AAR=amino acid
racemization; MS=magnetic susceptibility
1=Antoine
et al. (2009); 2=Bokhorst et al. (2009); 3=Buggle et al. (2009); 4=Dobosi
(1967); 5=Frechen et al. (1997); 6=Galović et al. (2009); 7=Gábori-Csánk
(1960); 8=Geyh et al. (1969); 9=Hupuczi et al. (2006); 10=Hupuczi & Sümegi (2010); 11=Koloszár & Marsi
(2005); 12=Krolopp &
Sümegi (2002); 13=Krolopp et al. (1996); 14=Lócskai et al. (2006); 15=Marković
et al. (2005); 16=Marković et al. (2006); 17=Marković et al. (2007);
18=Marković et al. (2008); 19=Marković et al. (2009); 20=Marsi et al. (2004);
21=Novothny et al. (2002); 22=Novothny et al. (2009); 23=Oches & McCoy (1995); 24=Pécsi &
Pevzner (1974); 25=Pécsi (1979); 26=Pécsi et al. (1979); 27=Pécsi (1985);
28=Schmidt et al. (2009); 29=Seppäla (1971); 30=Sümegi (2005); 31=Sümegi & Hertelendi (1998); 32=Sümegi et al. (2007); 33=Vogel & Waterbolk (1964); 34=Willis et al. (2000); 35=Wintle & Packman (1988); 36=Zöller et al. (1994); 37=Zöller & Wagner (1990).
Grain-size analysis
309 samples from Hungarian key-sites were collected (Fig. 2.), with the focus on sections comprising Upper Pleistocene loess deposits to determine typical granulometric characteristics. The grain-size distribution of all samples was measured after chemical treatment described by Konert & Vandenberghe, (1997). After treating the samples with (10 ml, 30%) H2O2 and (10 ml, 10%) HCl to remove the organic material and the carbonate, 10 ml of 3.6% Na4P2O7·10H2O was added to the samples in order to disperse the particles. All of the measurements were made on a Fritsch Analysette 22 Compact laser grain-size analyser, with 0.3–300 μm measurement ranges and a resolution of 62 channels.

Fig.2. Location of loess profiles considered in the paper. 1 – Süttő; 2 – Basaharc; 3 – Tápiósüly; 4 – Mende; 5 – Albertirsa; 6 – Dunaújváros; 7 – Ságvár; 8 – Paks; 9 – Üveghuta; 10 – Dunaszekcső; 11 – Zók; 12 – Hegyszentmárton; 13 – Beremend; 14 – Bodrogkeresztúr; 15 – Csorgókút I.; 16 – Csorgókút II.; 17 – Tokaj (Patkó-quarry); 18 – Tokaj (Kereszt Hill); 19 – Látókép; 20 – Debrecen (Alföldi brickyard); 21 – Lakitelek; 22 – Szeged-Öthalom; 23 – Madaras; 24 – Katymár; 25 – Zmajevac; 26 – Erdut; 27 – Crvenka; 28 – Susek; 29 – Irig; 30 – Ruma; 31 – Petrovaradin; 32 – Mošorin; 33 – Titel; 34 – Starí Slankamen; 35 – Surduk; 36 – Batajnica. (The 309 samples for the grain-size measurements were collected from Sites 2, 4, 8, 10, 11, 12, 13, 25.).
Estimation of past aeolian dust concentrations
Crucial points in the
discussion of past dust concentration are the reliable chronological framework
and the sedimentary features of aeolian deposits. The age data, together with
the stratigraphy determine the sedimentation rate (i.e. the amount of settled
dust), while the grain-size defines the dry deposition velocity of the
particles (i.e. the atmospheric residence time of the particles).
Dust flux
The sedimentation rate is
defined as:
SR= LLT / DD,
(Eq.1.)
where
LLT is the layer of loess thickness
in meters and DD is the duration of
deposition in years. By computing dust fluxes the effect of syn- and
post-sedimentary compaction can be compensated for
DF=SR × ρ, (Eq.2.)
where ρ is
dry bulk density, and DF represents
the mass of deposited dust per unit area per unit time (in g/m2/y). Recently
published age and sedimentation rate data and a dry density value of ρ=1.5 g/cm3
(Újvári et al., 2010) have been employed for calculations of DF. Since only
weakly developed paleosols and humic horizons intercalate loess deposits in the
investigated Upper Pleistocene sections, the same ρ=1.5 g/cm3 dry
bulk density has been used for the whole series.
Grain-size
and the proportion of background dust-load
According to recent observations,
two main sedimentary modes of aeolian dust transport and deposition can be recognized
(Pye, 1987, 1995): larger particles are transported by surface winds in short
suspension episodes, during discontinuous dust storms, smaller grains disperse
to higher levels of the atmosphere and are transported by upper level air flows
far from the source area as continuous back-ground dust load. However, it is
worth noting that in some cases even the larger particles can transported far
away from their source areas (Stuut et al. 2009). The two main modes of dust entrainment
can also be identified in the bimodal GSDs of aeolian dust deposits (Sun et al.,
2002, 2004; Varga, 2011 – Fig. 3.).

Fig.3. Typical grain-size distribution curves of Upper Pleistocene loess
samples from the Carpathian Basin.
The separation of these
sediment populations can be made by different mathematic techniques, including
parametric curve-fitting (PCF) and end-member modelling algorithms (EMMA –
Weltje, 1997; Weltje &
Prins, 2003; Vriend &
Prins, 2005). We believe that the differences (Weltje & Prins 2007) between these
two methods arise from their different approach and scope. Whereas EMMA is
based on the simultaneous analysis of the whole sequence based on the
covariance structure of the dataset, the input of the PCF is only one sample.
The resulting (and generally) three EMMA end-members of loess samples (Prins & Vriend, 2007; Prins et al., 2007)
represent the average dust GSD of three temporal aeolian sediment clusters of
seasonal or other short-term intervals. In the case of loess deposits, the PCF
populations are proposed to illustrate the background and the local-derived
dust components for each sample. The process-related partitioning of EMMA
end-members could justify the supposed differences of results of the two
methods (Fig. 4.).

Fig.4. Possible relationship
of different mathematical methods to partitioning grain-size distribution
curves: End-Member Modelling Algorithm (EMMA) and the Parametric Curve-Fitting
(PCF) methods.
In this study, as it is aimed at providing information on the amount of
background dust load, the PCF technique has been applied. According to this approach
the bimodal GSDs can be interpreted as the sum of two overlapping Weibull
functions (Sun et al., 2002, 2004). It must be emphasized here concerning the
Weibull distribution that the wind speed at a given site also follows this
continuous probability distribution (Lun & Lam 2000), and it is
expected that the GSDs of wind-blown sediments should reflect the transport
agent. The applied distribution function has a form of:
where W1 and W2
are the two sediment populations, α1
and α2 are the shape
parameters, defining the kurtosis of the curves (i.e. the sorting), β1 and β2 are the location parameters, defining the position of
the curves (i.e. the grain-size), while c1
and c2 are weighting
parameters. Iterative numerical methods were used to determine the location,
shape and weight parameters as a least-squares problem, and to assess the
appropriate goodness of fit of the measured and calculated data (Fig.5.).

Fig.5. Typical measured (a)
and mathematically partitioned (b) grain-size distribution curves of loess
samples from the Carpathian Basin.
Dust concentration
For Late Pleistocene dust concentration calculations only the continuous
background dust component of the grain-size distribution curves were used, owing
to the unknown magnitude and frequency of Pleistocene dust storm events. The
relatively short duration of dust storms and short atmospheric residence time
of storm-related coarse particles could be the source of significant
uncertainties in calculations.
Dust flux represents the mass of deposited dust per unit area per unit
time, so its quotient by the gravitational settling velocity (vs) will give the average
atmospheric dust concentration (C):
C
[μg/m3] = DF / vs. (Eq.4.)
The gravitational settling velocity, vs, for spherical particles
larger than 1 μm can be calculated approximately according to the Stokes Law as
a function of the square of the grain diameter:
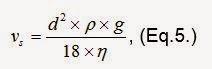
where d is the grain diameter, δ
is the particle density, g is gravity,
η is the dynamic viscosity of air.
The typical grain diameter of the background dust is given by:

where xi is the measurement range of the ith channel of the laser analyser, mi is the mass proportion of particles related to the
background dust population in the ith
channel. The gravitational settling velocities for different sizes of quartz
(2.65 g/cm3) in still air are shown in Fig.6.

Fig.6. Gravitational
settling velocities of different sizes of quartz particles in still air.
After these calculations, the dust concentration (C) can be expressed as

a function of the dust flux and the grain-size related gravitational
settling velocity.
Results
and discussion
The average sedimentation rate in the Carpathian Basin for the Late
Pleistocene can be set in the range 0.1 to 0.95 m/ky with a median value of
0.23 m/ky and a mean of 0.28 m/ky (Újvári et al., 2010). According to (Eq.2.),
the dust flux values related to the above sedimentation rates are 150 to ~1400
g/m2/y with median and mean values of 338 and 417 g/m2/y,
in general (the range of the first and third quartile) between 200 and 500 g/m2/y
(Table 2.). The 0.95 m/ky sedimentation rate and 1400 g/m2/y dust
flux of the Paks site is exceptionally high, which was possibly caused by the
activation of additional source areas. However, this observation needs further
investigations since the GSDs were similar to granulometric characteristics of
other sections.
Due to the low stratigraphic preservation potential of loess deposits,
being susceptible to reworking and redeposition, reconstructed sedimentation-rate
values depend on the geomorphological settings of the investigated sections. The
DF values were found by Újvári et al. (2010) to be higher on loess plateaus and
river terraces than on hill slopes and alluvial plains.
The bimodal grain-size distribution curves of the collected samples were
mathematically partitioned into sediment populations. Statistical parameters of
the separated components proved to be more useful for describing and analysing
the samples than traditional statistical measures such as mean grain size, etc.
The dust storm-related coarse-grained (7–71 μm) sediment population has
positive skewness and leptokurtic kurtosis, i.e. the material is well sorted:
it represents the dust material of local source areas (e.g. alluvial plains of
Danube, Tisza and other rivers – Buggle et al., 2008; Újvári et al., 2008). In
contrast to other well-studied regions (e.g. Chinese Loess Plateau), it is
difficult to draw conclusions from GSDs to source-to-sink distances in the
Carpathian Basin, due to the complex system of many local sources (Bokhorst et
al., 2011).
Skewness of the fine-grained (2.1–7.8 μm)
component produced by the background dust load, is also positive, but the
kurtosis is platykurtic, poorly sorted. The proportion of the background-dust
population varied between 12.65% and 17.95%, the typical grain size ranged from
4.1 to 4.4 μm. Further, the grain size of the fine-grained populations did not
show large differences; their average GSD illustrates well the regional features
of background dust load (Fig. 7.).

Fig.7. Sedimentary populations of the decomposed bimodal grain-size
distribution curve.
Based on the relationship
(Eq.7.) between dust concentration, dust flux and gravitational settling
velocity, the calculated value of the background dust concentration can be set
in the range of 1100 to 2750 μg/m3 if we count with regionally
typical 200–500 g/m2/y dust fluxes. Decomposition results are detailed
in Table 2. Because of the usage of average GSD, a correction coefficient of
±20% must be applied.
Table 2. Average Late Pleistocene sedimentation rates, dust flux and
dust concentration values in the Carpathian Basin (source of the SR and DF
values for the bulk samples: Újvári et al., 2008).
Site name
|
Bulk sample
|
Fine-grained population
|
|||
SR [m/ky]
|
DF [g/m2/y]
|
SR [m/ky]
|
DF [g/m2/y]
|
C [μg/m3]
|
|
Hungary
|
|||||
Albertirsa
|
0,39
|
587
|
0,05–0,07
|
74,3–105,4
|
1489–2113
|
Basaharc
|
0,23
|
348
|
0,03–0,04
|
44–62,5
|
878–1246
|
Bodrogkeresztúr I
|
0,25
|
381
|
0,03–0,04
|
48,2–68,4
|
955–1355
|
Csorgókút I
|
0,19
|
284
|
0,02–0,03
|
35,9–51
|
726–1030
|
Csorgókút II
|
0,3
|
453
|
0,04–0,05
|
57,3–81,3
|
1146–1626
|
Debrecen (Alföldi brickyard)
|
0,16
|
237
|
0,02–0,03
|
30–42,5
|
611–867
|
Dunaszekcső
|
0,47
|
707
|
0,06–0,08
|
89,4–126,9
|
1795–2547
|
Dunaújváros
|
0,83
|
1238
|
0,1–0,15
|
156,6–222,2
|
3170–4498
|
Katymár
|
0,42
|
632
|
0,05–0,08
|
79,9–113,4
|
1604–2276
|
Lakitelek I
|
0,17
|
254
|
0,02–0,03
|
32,1–45,6
|
649–921
|
Látókép
|
0,14
|
212
|
0,02–0,03
|
26,8–38,1
|
535–759
|
Madaras
|
0,25
|
375
|
0,03–0,04
|
47,4–67,3
|
955–1355
|
Mende
|
0,51
|
761
|
0,06–0,09
|
96,3–136,6
|
1948–2764
|
Paks
|
0,95
|
1422
|
0,12–0,17
|
179,9–255,2
|
3628–5148
|
Ságvár
|
0,12
|
176
|
0,02–0,02
|
22,3–31,6
|
458–650
|
Süttő
|
0,39
|
584
|
0,05–0,07
|
73,9–104,8
|
1489–2113
|
Szeged-Öthalom I
|
0,22
|
332
|
0,03–0,04
|
42–59,6
|
840–1192
|
Tápiósüly
|
0,34
|
504
|
0,04–0,06
|
63,8–90,5
|
1298–1842
|
Tokaj
(Kereszt Hill)
|
0,15
|
222
|
0,02–0,03
|
28,1–39,8
|
573–813
|
Tokaj
(Patkó-quarry)
|
0,22
|
332
|
0,03–0,04
|
42–59,6
|
840–1192
|
Üveghuta-2
|
0,23
|
338
|
0,03–0,04
|
42,8–60,7
|
878–1246
|
Croatia
|
|||||
Erdut
|
0,14
|
215
|
0,02–0,03
|
27,2–38,6
|
535–759
|
Zmajevac
|
0,29
|
437
|
0,04–0,05
|
55,3–78,4
|
1107–1571
|
Serbia
|
|||||
Batajnica
|
0,22
|
329
|
0,03–0,04
|
41,6–59,1
|
840–1192
|
Crvenka
|
0,13
|
197
|
0,02–0,02
|
24,9–35,4
|
496–704
|
Irig
|
0,13
|
192
|
0,02–0,02
|
24,3–34,5
|
496–704
|
Mošorin
|
0,26
|
395
|
0,03–0,05
|
50–70,9
|
993–1409
|
Petrovaradin
|
0,12
|
174
|
0,02–0,02
|
22–31,2
|
458–650
|
Ruma
|
0,13
|
192
|
0,02–0,02
|
24,3–34,5
|
496–704
|
Stari Slankamen
|
0,11
|
168
|
0,01–0,02
|
21,3–30,2
|
420–596
|
Surduk
|
0,29
|
434
|
0,04–0,05
|
54,9–77,9
|
1107–1571
|
Susek
|
0,1
|
150
|
0,01–0,02
|
19–26,9
|
382–542
|
Titel
|
0,34
|
510
|
0,04–0,06
|
64,5–91,5
|
1298–1842
|
These values match and many times exceed the present-day background dust
concentration values, even in arid, dusty regions (e.g. Gillies et al., (1996)
have observed 755 μg/m3 suspended, background dust concentration in
Sevaré, Mali). Still, during severe dust storms the concentration of the particles
can exceed 104–105 μg/m3 (Pye, 1987). Ganor
& Foner (2001) have measured 23 000 μg/m3 dust
concentration in the Negev, while Gillies et al., 1996 have reported more than
13 000 μg/m3 in the Sahara. However, the concentrations of
dust, even during intensive dust outbreaks, rarely reach the 1000 μg/m3
value at the Canary Islands (Querol et al., 2004) or at Cape Verde (Jaenicke
& Schütz, 1978). The highest "total dust concentration" ever
recorded in Australia was measured at the Birdsville station with a value of
29 000 μg/m3/y (McTainsh et al., 2009). (The total dust
concentration was defined as the sum of the daily dust concentration values.) But
the magnitude and frequency of Pleistocene dust storms is unknown, conclusions
can be made only on the magnitude of continuous background dust load.
As the visibility is strongly dependent on dust concentration (e.g. Chepil
& Woodruff, 1957), we are allowed to compute Late Pleistocene visibility
from our calculated dust concentration data. Below are some of the empirical
relationships derived by fitting dust concentration measurements to visibility,
and the opposite way:

where C is the dust concentration [μg/m3] and Vis
is the visibility in kilometres. According to Shao (2008), the differences of
(Eq.8.1–8.4) were caused by (1) small data sets; (2) effects of grain size and
humidity; and (3) subjectivity. However, it could be interesting to know more
about the visibility relations of the Late Pleistocene, also in regard to other
disciplines. From the viewpoint of archaeology, the limited view distance made
the orientation, hunting and communication of the prehistoric societies more
difficult.
The results of (Eq.8-3) and (Eq.8-4) provided too low visibility values
(<5 km) even at relatively low dust concentration (<200 μg/m3).
So, the Chepil–Woodruff and the Patterson–Gillette formulas were used in our
calculations. However these results have shown some differences as well,
therefore their combined minimum and maximum were chosen as limits of average visibility
(Fig. 8).

Fig.8. Relationship between the dust concentration and the visibility by
Chepil & Woodruff, (1957) and Patterson & Gillette, (1977), and the
estimated range of the Pleistocene dust concentration.
Based on the above-mentioned relationships, the average Late Pleistocene
visibility can be set in the range between 6.5 to 26 kilometres. According to
the World Meteorological Organization’s protocol, these values can be classified
into dust-in-suspension and blowing dust categories. However, these values are
averages and related only to the background dust load. During severe Late
Pleistocene dust storms the visibility could certainly drop to almost zero.
Conclusions
Aeolian dust deposits can be considered as one of the most important
archive of past environmental and climatic changes. The well-dated loess-paleosol
sequences from the Carpathian Basin reflect the Pleistocene
glacial-interglacial changes. By using the sedimentary data of these deposits;
conclusions can be made on the atmospheric dust load, especially for the last
glacial period.
The detailed grain-size measurements and the mathematical methods allow
us to separate the different sedimentation modes of dust particles. According
to Pye (1987) the fine-grained sediment population was formed during the almost
continuous deposition of the background dust with relatively long atmospheric
residence time. The background dust concentration can be expressed as the
function of stratigraphic and sedimentary parameters: as the quotient of dust
flux and gravitational settling velocity.
By using published data on sedimentation rate
and dust flux for Upper Pleistocene loess deposits (Újvári et al., 2010) and
average loess grain-size properties (determined from the several hundred
collected samples) the dust concentration can be set in the range between 1100 and
2750 μg/m3. These values are mostly higher than modern dust
concentrations, even in arid regions. Another interesting proxy of past
atmospheric conditions could be the visibility, being proportional to the dust
concentration. According to the known empirical dust concentration–visibility
equations, its value is around 6.5 to 26 kilometres. These values, however, are
only averages and relate to the background dust load, i.e. intense Late
Pleistocene dust storms could reduce the visibility close to zero. This means
that the aeolian dust might have affected past environments and the everyday
life of humans and animals as well.
References
Antoine, P., Rousseau, D. D., Fuchs, M., Hatté, C., Gauthier,
C., Marković, S. B., Jovanović, M., Gaudenyi, T., Moine, O. & Rossignol, J.,
2009. High-resolution record of the last climatic cycle in the southern
Carpathian Basin (Surduk, Vojvodina, Serbia). Quaternary International 198:
19−36.
Bokhorst, M.P., Beets, C.J., Markovic, S.B., Gerasimenko, N.P.,
Matviishina, Z.N. & Frechen, M., 2009. Pedo-chemical climate proxies in
Late Pleistocene Serbian-Ukranian loess sequences. Quaternary International
198: 113–123.
Bokhorst, M.P., Vandenberghe, J., Sümegi, P., Lanczont, M., Gerasimenko,
N.P., Matviishina, Z.N., Markovic, S.B. & Frechen, M., 2011. Atmospheric
circulation patterns in central and eastern Europe during the Weichselian
Pleniglacial inferred from loess grain-size records. Quaternary International
234: 62–74.
Buggle, B., Glaser, B., Zöller, L., Hambach, U., Markovic, S., Glaser,
I. & Gerasimenko, N. 2008. Geochemical characterization and origin of
southeastern and eastern European loesses. Quaternary Science Reviews 27: 1058–1075.
Buggle, B., Hambach, U., Glaser, B., Gerasimenko, N., Marković, S. B.,
Glaser, I. & Zöller, L., 2009. Stratigraphy, and spatial and temporal
paleoclimatic trends in Southeastern/Eastern European loess–paleosol sequences.
Quaternary International 196: 86–106.
Chepil, W. S. & Woodruff, N. P., 1957. Sedimentary characteristics
of dust storms – visibility and dust concentration. American Journal of Science
255: 104–114.
Dobosi, V., 1967. Új felső-paleolit telep az Alföldön. (New Upper
Paleolithic settlement on the Great Hungarian Plain). Archeológiai Értesítő 94:
184–193.
EPICA community members, 2004. Eight glacial cycles from an Antarctic
ice core. Nature 429: 623–628.
Frechen, M., Horvath, E. & Gabris, G. 1997. Geochronology of middle
and upper Pleistocene loess sections in Hungary. Quaternary Research 48:
291–312.
Gábori-Csánk, V., 1960. A ságvári telep abszolút kormeghatározása.
(Absolute age determination of the settlement at Ságvár). Archeológiai Értesítő
87: 125–129.
Gábris, Gy., 2007. The relation between the time scale of the Quaternary
surface processes and oxygen isotope stratigraphy – according to the
loess–palaeosoil sequences and river terraces in Hungary. Földtani Közlöny 137:
515–540.
Galović, L., Frechen, M., Halamić, J., Durn, G. & Romić, M., 2009.
Loess chronostratigraphy in Eastern Croatia − A luminescence dating approach.
Quaternary International 198: 85−97.
Ganor, E. & Foner, H.A., 2001. Mineral dust concentrations,
deposition fluxes and deposition velocities in dust episodes over Israel.
Journal of Geophysical Research. Atmospheres 106. (D16) pp. 18431–18438.
Geyh, M.A., Schweitzer, F., Vértes, L. & Vogel, I.C., 1969. A
magyarorszagi würmi eljegesedés új kronológiai adatai. (New chronological data
of the Weichselian glaciation in Hungary). Földrajzi Közlemények 18: 5–18.
Gillies, J.A., Nickling, W.G. & McTainsh, G.H., 1996. Dust
concentration and particle-size characteristics of an intense dust haze event:
Inland Delta Region, Mali, West Africa. Atmospheric Environment 30: 1081–1090.
Harrison, S.P., Kohfeld, K.E., Roelandt, C. & Claquin, T., 2001. The
role of dust in climate changes today, at the last glacial maximum and in the
future. Earth-Science Reviews 54: 43–80.
Hupuczi, J., Lócskai, T., Hum, L. & Sümegi, P., 2006. Heinrich
események kimutatása hazai löszszelvény alapján. (The demonstration of Heinrich
events in Hungarian loess profiles). Malakológiai Tájékoztató 24: 31–34.
Hupuczi, J. & Sümegi, P., 2010. The Late Pleistocene
paleoenvironment and paleoclimate of the Madaras section (South Hungary), based
on preliminary records from mollusks. Central European Journal of Geosciences
2: 64–70.
Jaenicke, R. & Schütz, L., 1978. Comprehensive study of physical and
chemical properties of the surface aerosols in the Cape Verde Islands regions.
Journal of Geophysical Research. Oceans and atmospheres 83: 3585–3599.
Jickells, T.D., An Zhisheng, Andersen, K.K., Baker, A.R., Bergametti,
G., Brooks, N., Cao Junji, Boyd, P.W., Duce, R.A., Hunter, K.A., Kawahata, H.,
Kubilay, N., laRoche, J., Liss, P.S., Mahowald, N., Prospero, J.M., Ridgwell,
A.J., Tegen, I. & Torres, R., 2005. Global iron connections between desert
dust, ocean biogeochemistry, and climate. Science 308: 67–71.
Kohfeld, K.E. & Tegen, I., 2007. Record of Mineral Aerosols and
Their Role in the Earth System. Treatise on Geochemistry 4: 1–26.
Konert, M. & Vandenberghe, J., 1997. Comparison of laser grain-size
analysis with pipette and sieve analysis: a solution for the underestimation of
the clay fraction. Sedimentology 44: 523–535.
Koloszár, L. & Marsi, I., 2005. Formations of Late Neogene and
Pleistocene terrestrial sediments in the region of Mórágy Hill (Hungary). Acta
Geologica Hungarica 48: 317–337.
Kovács, J., 2008. Grain-size analysis of the Neogene red clay formation
in the Pannonian Basin. International Journal of Earth Sciences 97: 171–178.
Kovács, J., Varga, Gy. & Dezső, J., 2008. Comparative study on the
Late Cenozoic red clay deposits from China and Central Europe (Hungary).
Geological Quarterly 52: 369–382.
Krolopp, E. & Sümegi, P., 2002. A ságvári lösz-rétegsor
csigafaunája. (The mollusc fauna of the Ságvár loess profile). Malakológiai
Tájékoztató 20: 7–14.
Krolopp, E., Sümegi, P., Kuti, L., Hertelendi, E. & Kordos, L.,
1996. Szeged környéki löszképződmények keletkezésének paleoökológiai
rekonstrukciója. (Palaeoecological reconstruction of the formation of loess
deposits in the environs of Szeged). Földtani Közlöny 125: 309–361.
Lisiecki, L. & Raymo, M.E., 2005. A Pliocene–Pleistocene stack of 57
globally distributed benthic δ18O records. Paleoceanography 20:
PA1003. 17 p.
Lócskai, T., Hupuczi, J., Hum, L. & Sümegi, P., 2006.
Dansgaard-Oeschger ciklusok kimutatása hazai löszszelvényből. (The
demonstration of Dansgaard-Oeshger cycles from Hungarian loess profiles).
Malakológiai Tájékoztató 24: 35–39.
Lun, I.Y.F. & Lam, J.C., 2000. A study of Weibull parameters using
long-term wind observations. Renewable Energy 20: 145–153.
Mahowald, N. M., Muhs, D. R., Levis, S., Rasch, P. J., Yoshioka, M.,
Zender, C. S. & Luo, C., 2006. Change in atmospheric mineral aerosols in
response to climate: Last glacial period, preindustrial, modern, and doubled
carbon dioxide climates. Journal of Geophysical Research 111, D10202. 22 p.
Markovic, S.B., Kostic, N. & Oches, E.A., 2004. Paleosols in the
Ruma loess section. Revista Mexicana de Ciencias Geológicas 21: 79–87.
Markovic, S.B., McCoy, W.D., Oches, E.A., Savic, S., Gaudenyi, T.,
Jovanovic, M., Stevens, T., Walther, R., Ivanisevic, P. & Galic, Z., 2005.
Paleoclimate record in the upper Pleistocene loess–palaeosol sequence at
Petrovaradin brickyard (Vojvodina, Serbia). Geologica Carpathica 56: 545–552.
Markovic, S.B., Oches, E.A., Sümegi, P., Jovanovic, M. & Gaudenyi,
T., 2006. An introduction to the middle and upper Pleistocene loess-palaeosol
sequence at Ruma brickyard, Vojvodina, Serbia. Quaternary International 149:
80–86.
Markovic, S.B., Oches, E.A., McCoy, W.D., Frechen, M. & Gaudenyi,
T., 2007. Malacological and sedimentological evidence for ‘warm’ glacial
climate from the Irig loess sequence, Vojvodina, Serbia. Geochemistry
Geophysics Geosystems 8: Q09008. 12 p.
Markovic, S.B., Bokhorst, M.P., Vandenberghe, J., McCoy, W.D., Oches,
E.A., Hambach, U., Gaudenyi, T., Jovanovic, M., Stevens, T., Zöller, L. &
Machalett, B., 2008. Late Pleistocene loess-palaeosol sequences in the
Vojvodina region, North Serbia. Journal of Quaternary Science 23: 73–84.
Markovic, S.B., Hambach, U., Catto, N., Jovanovic, M., Buggle, B.,
Machalett, B., Zöller, L., Glaser, B. & Frechen, M., 2009. The middle and
late Pleistocene loess-palaeosol sequences at Batajanica, Vojvodina, Serbia.
Quaternary International 198: 255–266.
Marsi, I., Don, Gy., Földvári, M., Koloszár, L., Kovács-Pálffy, P.,
Krolopp, E., Lantos, M., Nagy-Bodor, E. & Zilahi-Sebess, L., 2004.
Quaternary sediments of the northeastern Mórágy Block. Annual Report of the
Geological Institute of Hungary for the Year 2003: 343–359.
McTainsh, G.H. & Pitblado, J.R., 1987. Dust storms and related
phenomena measured from meteorological records in Australia. Earth Surface
Processes and Landforms 12: 415–424.
McTainsh, G.H., Nickling, W.G. & Lynch, A.W. 1997. Dust deposition
and particle size in Mali, West Africa. Catena 29: 307–322.
McTainsh, G.H., Strong, C. & Leys, J., 2009.
Wind erosion histories, model input data and community DustWatch. Atmospheric
Environment Research Centre, Griffith University, Brisbane: 221 p.
Novothny, Á., Horváth, E. & Frechen, M., 2002.
The loess profile at Albertirsa, Hungary –improvements in loess stratigraphy by
luminescence dating. Quaternary International 95/96: 155–163.
Novothny, Á., Frechen, M., Horváth, E., Bradák, B.,
Oches, E.A., McCoy, W.D. & Stevens, T., 2009. Luminescence and amino acid
racemization chronology of the loess–paleosol sequence at Süttő, Hungary.
Quaternary International 198: 62−76.
Oches, E.A. & McCoy, W.D., 1995. Aminostratigraphic evaluation of
conflicting age estimates for the “Young Loess” of Hungary. Quaternary Research
44: 160–170.
Patterson, E.M. & Gillette, D.A. 1977. Measurements of visibility
vs. mass concentration for airborne soil particles. Atmospheric Environments
10: 83−96.
Peticzka, R., Holawe, F. & Riegler, D. 2010. Structural analyses on
the modified paleosol-sequence of “Stillfried B” with high resolution
measurements of selected laboratory parameters. Quaternary International 222:
168–177.
Pécsi, M., 1968. Loess. In: Fairbridge, R.W. (ed.): The Encyclopaedia of
Geomorphology, Reinhold, New York: 674–678.
Pécsi, M., 1979. Lithostratigraphical subdivision of the loess profiles
at Paks. Acta Geologica Hungarica 22: 409–418.
Pécsi, M., 1985. Chronostratigraphy of Hungarian loesses and underlying
subaerial formation. In: Pécsi, M. (ed.), Loess and the Quaternary: Chinese and
Hungarian Case Studies. Studies in Geography in Hungary 18: 33–49.
Pécsi, M. 1990. Loess is not just the accumulation of dust. Quaternary
International 7–8: 1–21.
Pécsi, M. & Pevzner, M.A., 1974. Paleomagnetic measurements in the
loess sequences at Paks and Dunaföldvár, Hungary. Földrajzi Közlemények 22:
215–224.
Pécsi, M. & Schweitzer, F., 1995. The lithostratigraphical,
chronostratigraphical sequence of Hungarian loess profiles and their
geomorphological position. In: Pécsi, M. & Schweitzer, F. (eds.): Loess
InForm 3. Concept of loess, loess-paleosol stratigraphy. MTA FKI, Budapest:
31–61.
Pósfai, M. & Buseck, P.R., 2010. Nature and climate effects of
individual tropospheric aerosol particles. Annual Review of Earth and Planetary
Sciences 38: 17–43.
Prins, M. A. & Vriend, M., 2007. Glacial and interglacial eolian
dust dispersal patterns across the Chinese Loess Plateau inferred from
decomposed loess grain-size records. Geochemistry, Geophysics, Geosystems 8:
Q07Q05. 17 p.
Prins, M.A., Vriend, M., Nugteren, G., Vandenberghe, J., Lu, H., Zheng,
H. & Weltje, G.J., 2007. Late Quaternary aeolian dust flux variability on
the Chinese Loess Plateau: Inferences from unmixing of loess grain-size
records. Quaternary Science Reviews 26: 230–242.
Pye, K., 1987. Aeolian Dust and Dust Deposits. Academic Press, London:
334 p.
Pye, K., 1995. The nature, origin and accumulation of loess. Quaternary
Science Reviews 14: 653–667.
Querol, X., Alastuey, A., Rodríguez, S., Viana, M.M., Artíñano, B.,
Salvador, P., Mantilla, E., García do Santos, S., Fernandez Patier, R., de La
Rosa, J., Sanchez de la Campa, A., Menéndez, M. & Gil, J.J., 2004. Levels
of particulate matter in rural, urban and industrial sites in Spain. Science of
The Total Environment 334–335: 359–376.
Ridgwell, A.J. 2002. Dust in the Earth system: the biogeochemical
linking of land, air and sea. Philosophical Transactions of the Royal Society
A. 360: 2905–2924.
Rosenfeld, D., Rudich, Y. & Lahav, R. 2001. Desert dust suppressing precipitation:
A possible desertification feedback loop. The Proceedings of the National
Academy of Sciences of the United States of America 98: 5975–5980.
Sassen, K., DeMott, P.J., Prospero, J.M. & Poellot, M.R. 2003.
Saharan dust storms and indirect aerosol effects on clouds: CRYSTALFACE
results. Geophysical Research Letters 30: 1633. 4 p.
Schmidt, E.D., Machalett, B., Marković, S.B., Tsukamoto, S. &
Frechen, M., 2009. Luminescence chronology of the upper part of the Stari
Slankamen loess sequence (Vojvodina, Serbia). Quaternary Geochronology: 1–6.
Seppäla, M., 1971. Stratigraphy and material of the loess layers at
Mende, Hungary. Bulletin of the Geological Society of Finland 43: 109–123.
Shao, Y. 2008. Physics and Modelling of Wind Erosion. (2nd Revised and
Expanded Edition) Springer: 452 pp.
Shao, Y., Yang, Y., Wang, J. J., Song, Z. X., Leslie, L. M., Dong, C.
H., Zhang, Z. H., Lin, Z. H., Kanai, Y., Yabuki, S. & Chun, Y.S., 2003.
Real-time numerical prediction of northeast Asian dust storms using an
integrated modeling system. Journal of Geophysical Research 108: 4691. 18 p.
Sun, D., Bloemendal, J., Rea, D.K., Vandenberghe, J., Jiang, F., An, Z. &
Su, R., 2002. Grain-size distribution function of polymodal sediments in
hydraulic and aeolian environments, and numerical partitioning of the
sedimentary components. Sedimentary Geology 152: 263–277.
Sun, D., Bloemendal, J., Rea, D.K., An, Z., Vandenberghe, J., Lu, H.,
Su, R. & Liu, T.S., 2004. Bimodal grain-size distribution of Chinese loess,
and its paleoclimatic implications. Catena 55: 325–340.
Sümegi, P., 2005. Loess and Upper Paleolithic Environment in Hungary.
Aurea Kiadó, Nagykovácsi: 312 pp.
Sümegi, P. & Hertelendi, E., 1998. Reconstruction of
microenvironmental changes in Kopasz Hill loess area at Tokaj (Hungary) between
15,000-70,000 BP years. Radiocarbon 40: 855–863.
Sümegi, P., Molnár, M., Svingor, É., Szántó, Zs, Hum, L. & Gulyás,
S., 2007. Results of radiocarbon analysis of Upper Weichselian loess sequences
from Hungary. Radiocarbon 49: 1023–1030.
Stevens, T., Markovic, S.B., Zech, M., Hambach, U. & Sümegi, P.,
2011. Dust deposition and climate in the Carpathian Basin over an independently
dated last glacial-interglacial cycle. Quaternary Science Reviews 30: 662–681.
Stuut, J-B., Smalley, I. & O’Hara-Dhand, K. 2009. Aeolian dust in
Europe: African sources and European deposits. Quaternary International 198:
234–245.
Tegen, I., Lacis, A. A. & Fung, I., 1996. The influence of mineral
aerosols from disturbed soils on climate forcing. Nature 380: 419–422.
Tews, E. K., 1996. Wind erosion rates from meteorological records in
eastern Australia 1960-92. B.Sc. thesis, Griffith University
Újvári, G., Varga, A. & Balogh-Brunstad, Z., 2008. Origin,
weathering, and geochemical composition of loess in southwestern Hungary.
Quaternary Research 69: 421–437.
Újvári, G., Kovács, J., Varga, Gy., Raucsik, B. & Marković, S.B.,
2010. Dust flux estimates for the Last Glacial Period in East Central Europe
based on terrestrial records of loess deposits: a review. Quaternary Science
Reviews 29: 3157–3166.
Varga, Gy., 2011. Similarities among the Plio–Pleistocene terrestrial
aeolian dust deposits in the world and in Hungary. Quaternary International
234: 98–108.
Vogel, I.C. & Waterbolk, H.T., 1964. Groningen radiocarbon dates. V.
Radiocarbon 6: 349–369.
Vriend, M. & Prins, M.A., 2005. Calibration of modelled mixing patterns
in loess grain-size distributions: an example from the north-eastern margin of
the Tibetan Plateau, China. Sedimentology 52: 1361–1374.
Weltje, G.J., 1997. End-member modeling of compositional data:
numerical–statistical algorithms for solving the explicit mixing problem.
Journal of Mathematical Geology 29: 503–549.
Weltje, G.J. & Prins, M.A. 2003. Muddled or mixed? Inferring
palaeoclimate from size distributions of deep-sea clastics. Sedimentary Geology
162: 39–62.
Weltje, G.J. & Prins, M.A. 2007. Genetically meaningful
decomposition of grain-size distributions. Sedimentary Geology 202: 409–424.
Willis, K.J., Rudner, Z.E. & Sümegi, P., 2000. Full-glacial forests
of Central and South Eastern Europe. Quaternary Research 53: 203–213.
Wintle, A.G. & Packman, S.C., 1988. Thermoluminescence ages for
three sections in Hungary. Quaternary Science Reviews 7: 315–320.
Zender, C. S., Bian, H. S. & Newman, D., 2003. Mineral Dust
Entrainment and Deposition (DEAD) model: Description and 1990s dust
climatology. Journal of Geophysical Research – Atmospheres 108: 4416. 19 p.
Zöller, L., Oches, E.A. & McCoy, W.D., 1994. Towards a revised
chronostratigraphy of loess in Austria with respect to key sections in the
Czech Republic and in Hungary. Quaternary Geochronology/Quaternary Science
Reviews 13: 465–472.
Zöller, L. & Wagner, G.A., 1990.
Thermoluminescence dating of loess – recent developments. Quaternary
International 7/8: 119–128.
No comments:
Post a Comment